Color Memory Test
Remember several shades and find them on the colour chart as another shade is added after every correct round.
Settings
Changing one restarts the attempt, and scores set under different settings are not comparable.
Quick start
- 1Press Play. A few coloured squares appear side by side.
- 2Study the shades. Where they sit tells you nothing.
- 3The squares clear. A chart of 24 shades takes their place.
- 4Tap every shade that was in the set. Any order counts.
- 5Rebuild the whole set and the next one is a shade longer.
- 6Three wrong picks end the run.
Loading test
Why there is no comparison
Largest set of shades rebuilt (shades). Higher is better. No published distribution exists for this task.
Every other test here draws your score on a bar of published results. This one cannot. Nobody has measured enough people on this task to say what a typical result is, so a bar here would be a picture of a number we made up.
Numbers for this task do circulate. The ones we could find name no study and do not agree with each other. We would rather show you nothing than repeat one of those.
No published distribution, and not CognitiveDrill data either. Nobody has measured this task on a large enough sample to say what a typical result is, so this page shows your number and does not rank it. Our own norm is published once a cohort reaches n = 1,000.
Try next
About this test
A colour is not a place
The other picture-based tests in this hub are really tests of position. Visual memory lights some squares in a grid and asks which ones. Corsi block tapping asks the same question with an order attached. In both, what you store is a location, and the colour of the thing at that location is the same every time.
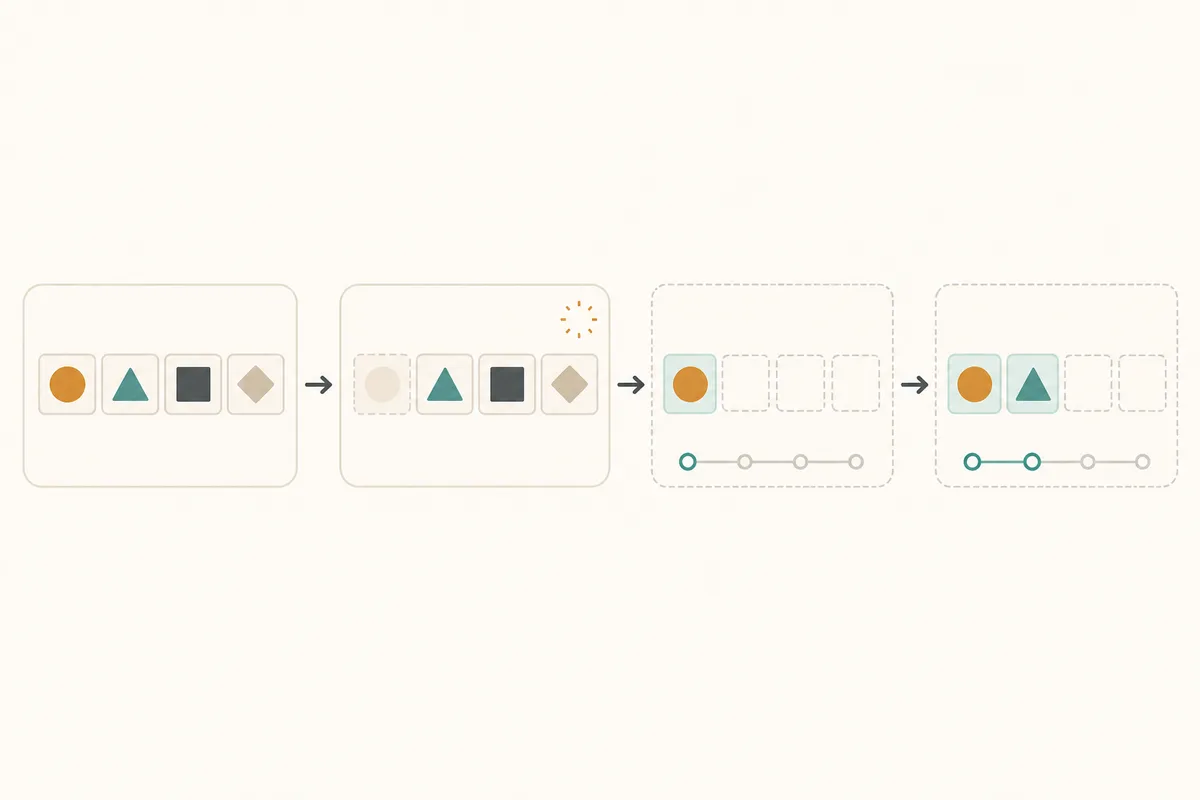
This one throws position away. The squares you study sit in a random line. The chart you answer on is always laid out the same way. One column for each of six hues, one row for each of four lightnesses. Nothing about where a shade sat while you were looking at it helps you find it on the chart. The only thing carried across the gap is the colour itself.
That is a real division in the laboratory work as well. Colour is stored as a feature. Features have their own limit, and it has nothing to do with how many places you can track. Luck and Vogel measured that limit directly in 1997, and it came out near three items whether the array held four squares or twelve.
The chart never changes, and that is the measurement
There are exactly 24 shades on this test and they are the same 24 in every set, in every round, in every run. By your third round you are no longer working out whether two shades differ. You are only asking whether this one was in the set you just saw.
A palette mixed fresh each round would be a different test wearing the same title. Fine shade discrimination depends on your panel, your brightness setting and the light in the room. A score built on it would move when you changed desks. Fixing the chart pushes almost all of that out of the number.
It does not push all of it out. A very dim screen flattens the four lightness steps, and a colour filter such as a night mode shifts every hue at once. Turn both off before a run you want to keep.
Almost everybody turns the colours into words
Watch what you do on the second round. Most people stop looking and start naming: deep red, pale blue, that greenish one. The naming is not cheating and it is not a flaw in the test. It is the ordinary way people hold colours for a few seconds. The shades here are spaced far enough apart to have names, for exactly that reason.
It does mean the number is a joint one. Part of it is how much colour your visual memory holds. The rest is how fast you attach a label and keep the labels apart. That mix is why the score climbs on your first few runs and then flattens: you are getting better at labelling, not bigger at storing.
The blank pause setting is the cleanest way to see the labelling at work. At half a second there is barely time to name anything and the raw colour is still there. At eight seconds the raw colour has largely gone and whatever you managed to say to yourself is all that is left. Most people lose very little between the two, which tells you which of the two they were using all along. How working memory works covers the rehearsal loop that makes this possible.
Why this page shows no percentile
Colour working memory has been measured carefully for nearly thirty years, and none of that measurement fits this page. The published figure is a capacity estimate called K, worked back from how often people spot a change in a briefly repeated array. Zhang and Luck put it at about 2.9 items in 2008. Nobody in those studies ever rebuilt a set from a chart.
Our task is easier than theirs in two ways that matter. You get three attempts rather than one, and the answer options are in front of you while you answer. Both push the number up, by an amount nobody has published. Shaping a percentile curve around 2.9 anyway would be an invented distribution with two real citations stapled to it.
So the page reports your number, keeps your history, and says plainly that it cannot rank you. When enough runs have been recorded here to build a real distribution, one goes up, with its sample size attached. Until then, the useful comparison is against your own earlier runs. What counts as a good digit span explains why comparing a span to a stranger's is usually less informative than it looks.
Getting a number worth keeping
Three things move this score more than anything about your memory does, and all three are yours to control.
- Screen brightness. Four lightness steps become three on a dim panel, and the run gets harder for a reason that has nothing to do with you.
- Night filters. A warm-shift mode drags every hue towards orange and squashes the distance between the red and orange columns.
- Runs in a row. The chart is learnt after two or three rounds, so a first run understates you. Take three and keep the middle one.
Questions
What is a good color memory score?
Nobody knows, and this page will not guess. There is no published distribution for rebuilding a set of shades from a fixed chart, so we show your number and refuse to rank it.
Does the order I pick the shades in matter?
No. Any order counts. Demanding an order would smuggle sequence memory into a test that is meant to measure colour alone.
Is this a colour blindness test?
No, and it cannot be used as one. It is a memory task, the chart varies lightness as well as hue, and a browser cannot control what your screen does with either.
Why does my score jump around between runs?
Because one wrong tap ends a set, and a set is worth a whole point. Three runs give you a far steadier figure than one does.
Is naming the colours allowed?
Yes, and nearly everybody does it. Holding a shade by its name is what people do away from a test. Forbidding it here would measure a skill nobody uses.
Why is there a setting for the blank pause?
Because a raw colour memory fades in a few seconds while a name for it does not. Comparing your half-second score with your eight-second score shows you which one you were leaning on.
Sources
- Luck SJ, Vogel EK (1997). The capacity of visual working memory for features and conjunctions. Nature, 390(6657), 279-281. Link
- Zhang W, Luck SJ (2008). Discrete fixed-resolution representations in visual working memory. Nature, 453(7192), 233-235. Link
- Cowan N (2001). The magical number 4 in short-term memory: a reconsideration of mental storage capacity. Behavioral and Brain Sciences, 24(1), 87-114. Link