Schulte Table
Find the numbers 1 to 25 across five shuffled grids and see how your speed changes from the first table to the last.
Settings
Changing one restarts the attempt, and scores set under different settings are not comparable.
Quick start
- 1Pick a grid size. Five by five is the standard table.
- 2Tap the 1. The clock starts there and not before.
- 3Work up to the last number in order. Wrong taps are counted and the clock keeps running.
- 4Hold your eyes on the centre mark and find the numbers around it.
- 5Finish the set. Your median table time is the score.
Loading test
Why there is no comparison
Median table time (s). Lower is faster. No published distribution exists for this task.
Every other test here draws your score on a bar of published results. This one cannot. Nobody has measured enough people on this task to say what a typical result is, so a bar here would be a picture of a number we made up.
Numbers for this task do circulate. The ones we could find name no study and do not agree with each other. We would rather show you nothing than repeat one of those.
No published distribution, and not CognitiveDrill data either. Nobody has measured this task on a large enough sample to say what a typical result is, so this page shows your number and does not rank it. Our own norm is published once a cohort reaches n = 1,000.
Try next
About this test
A grid is an easier place to search than a scatter
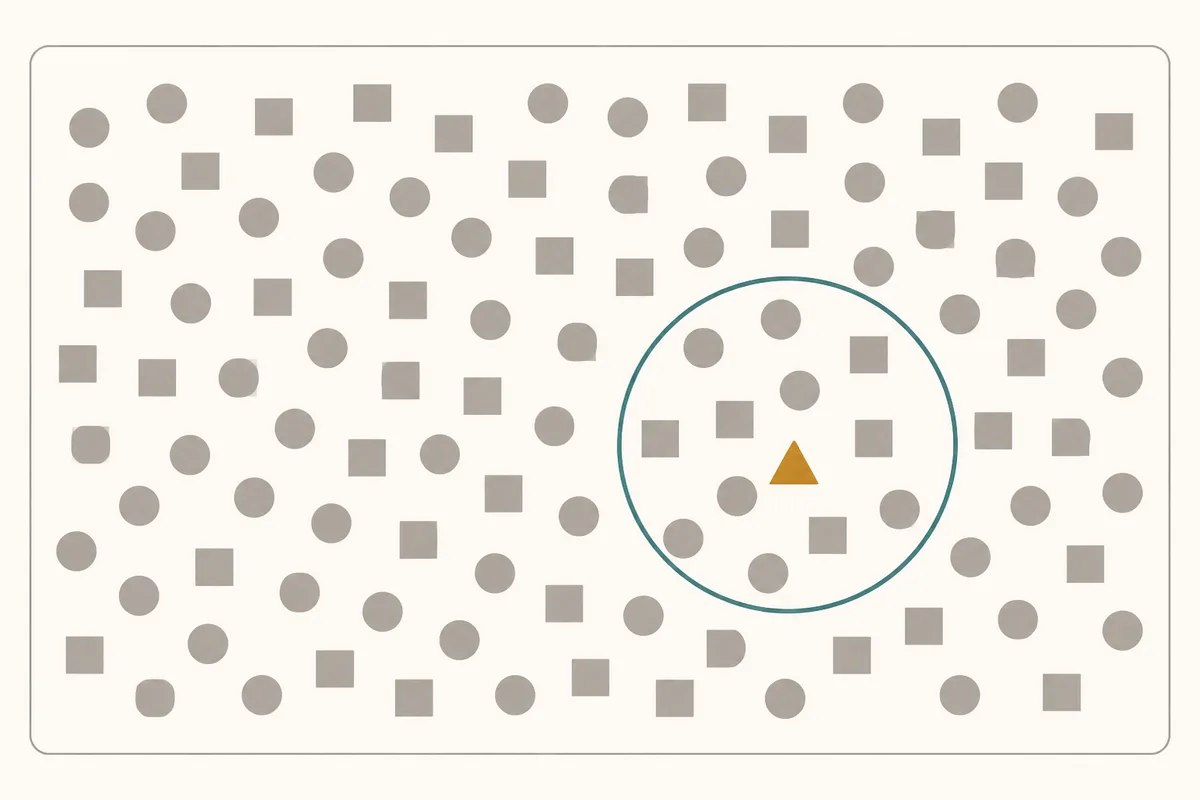
The numbers sit in fixed rows and columns. That sounds like a small detail. It is the whole difference between this and the trail making test, where the same 25 numbers are thrown across the page at random.
A grid gives your eye a route. You can sweep a row, drop to the next one, and know you have not missed anything. A scatter gives you nothing to hold on to, so you re-check places you have already looked. Searching a known layout and searching an unknown one are two different jobs, and they come out as two different times.
Anne Treisman's work on visual search is the reason the difference shows up. A number among other numbers shares every feature with its neighbours, so nothing about it pops out. You have to look at items more or less one at a time. Jeremy Wolfe's later work put figures on how much the layout changes that rate. A tidy arrangement is worth a lot.
Why this page has no average to show you
Every other test here draws your score on a bar built from published results. This one does not, and that is deliberate.
Search for a typical Schulte time and you will be told 37.7 seconds. You will also be told that 8 seconds is a good adult result, and that beginners take 40 to 60. Those are the same task and the same grid. They disagree by a factor of five, and not one of them names a study.
We looked for the study. The nearest thing in the peer-reviewed literature is Lu and colleagues in 2022. They put 27 children aged 8 to 11 in front of a modified two-colour grid and measured brain responses. It reports time per number, not time per table, and 27 children is not a distribution of adult times.
So there is nothing honest to rank you against. Building a curve anyway would mean picking a shape out of the air and printing a caveat under it. That is how the numbers above got into circulation. Instead the page reports your time and your own history. For the argument in full, read what is a good reaction time. A single average is a weak thing to chase even when a real one exists.
Five tables, because one is a coin toss
A single table is one sample of a noisy process. Three things move your time by several seconds in either direction, and none of them are about you.
- Where the 1 happens to land.
- Whether the 17 sits next to the 18.
- How awake you were for those forty seconds.
The drift is the part worth watching
The classic procedure runs five tables back to back, and this one defaults to the same. The score is the median of the set, so one unlucky table cannot drag it.
The drift is your last table minus your first. A negative drift means you sped up, which usually means the first table was really you learning where to look. A positive drift means you slowed down across two or three minutes of steady searching. That is a small window onto the thing the task is for.
Treat it gently. It is a difference between two single tables, so it carries all the noise of both. Age matters here as it does everywhere in this kind of measure. See average reaction time by age for how steeply speed moves across a lifetime.
What the centre mark is for, and what it is not
The traditional instruction is to hold your gaze on the middle of the table. Find the numbers with the edge of your vision rather than by looking straight at them. The dashed centre cell is there so you have something to hold onto. Turn it off in the settings if you would rather scan freely.
This is where the claims start, so here they are plainly. Schulte tables are sold as a way to widen your field of view and to make you read faster. Those claims are marketing, not findings. Nobody has shown that tapping numbers in a grid changes how wide your vision is or how fast you get through a page of prose.
What is true is narrower and duller. Practise this task and you get faster at this task. That is worth having if you enjoy the chase, and it does not generalise beyond the grid without supporting evidence.
Questions
What is a good Schulte table time?
Nobody knows, and this page will not pretend otherwise. No published study reports a distribution of adult table times. The figures quoted elsewhere disagree by a factor of five and name no source, so the only honest benchmark is your own previous run.
Does the Schulte table improve peripheral vision?
There is no evidence that it does. The claim is common in speed-reading marketing and it has not been demonstrated. Practising the task makes you better at the task.
Will this make me read faster?
No study shows that it will. Reading speed depends on how quickly you recognise words and follow meaning, which is a different job from finding numbers in a grid.
Why five tables instead of one?
One table is a single noisy sample. Five gives a median that does not swing on where the 1 happened to land. It also shows whether you slowed down across the run.
Does a bigger grid make my score worse?
Yes, and steeply. A 7 by 7 grid holds 49 numbers rather than 25, so the times are not comparable across sizes. Stay on one size if you want to track yourself.
How is this different from the trail making test?
Trail making scatters the targets and its headline number comes from alternating numbers with letters. This grid never alternates and never moves, so it measures searching a fixed layout and nothing about switching between two sequences.
Sources
- Lu A, Wang D, He S, Zhongcheng Q, Zhang W, Li Z (2022). Attention mechanisms underlying dual-color digital visual search based on Schulte grid: An event-related potential study. Brain and Behavior, 12(2), e2471. Link
- Treisman AM, Gelade G (1980). A feature-integration theory of attention. Cognitive Psychology, 12(1), 97-136. Link
- Wolfe JM (1998). What can 1 million trials tell us about visual search? Psychological Science, 9(1), 33-39. Link
- Tombaugh TN (2004). Trail Making Test A and B: normative data stratified by age and education. Archives of Clinical Neuropsychology, 19(2), 203-214. Link