Symbol Search Test
Compare two symbols with a group of five, answer yes or no, and see how long your typical decision took.
Settings
Changing one restarts the attempt, and scores set under different settings are not comparable.
Quick start
- 1Read the two symbols on the left of the row.
- 2Look along the five symbols on the right.
- 3Press Yes if either of the two is in there.
- 4Press No if neither of them is.
- 5Keep going. The next row arrives the moment you answer.
Loading test
Why there is no comparison
Median decision time (ms). Lower is faster. No published distribution exists for this task.
Every other test here draws your score on a bar of published results. This one cannot. Nobody has measured enough people on this task to say what a typical result is, so a bar here would be a picture of a number we made up.
Numbers for this task do circulate. The ones we could find name no study and do not agree with each other. We would rather show you nothing than repeat one of those.
No published distribution, and not CognitiveDrill data either. Nobody has measured this task on a large enough sample to say what a typical result is, so this page shows your number and does not rank it. Our own norm is published once a cohort reaches n = 1,000.
Try next
About this test
One row, one question, and the answer is yes or no
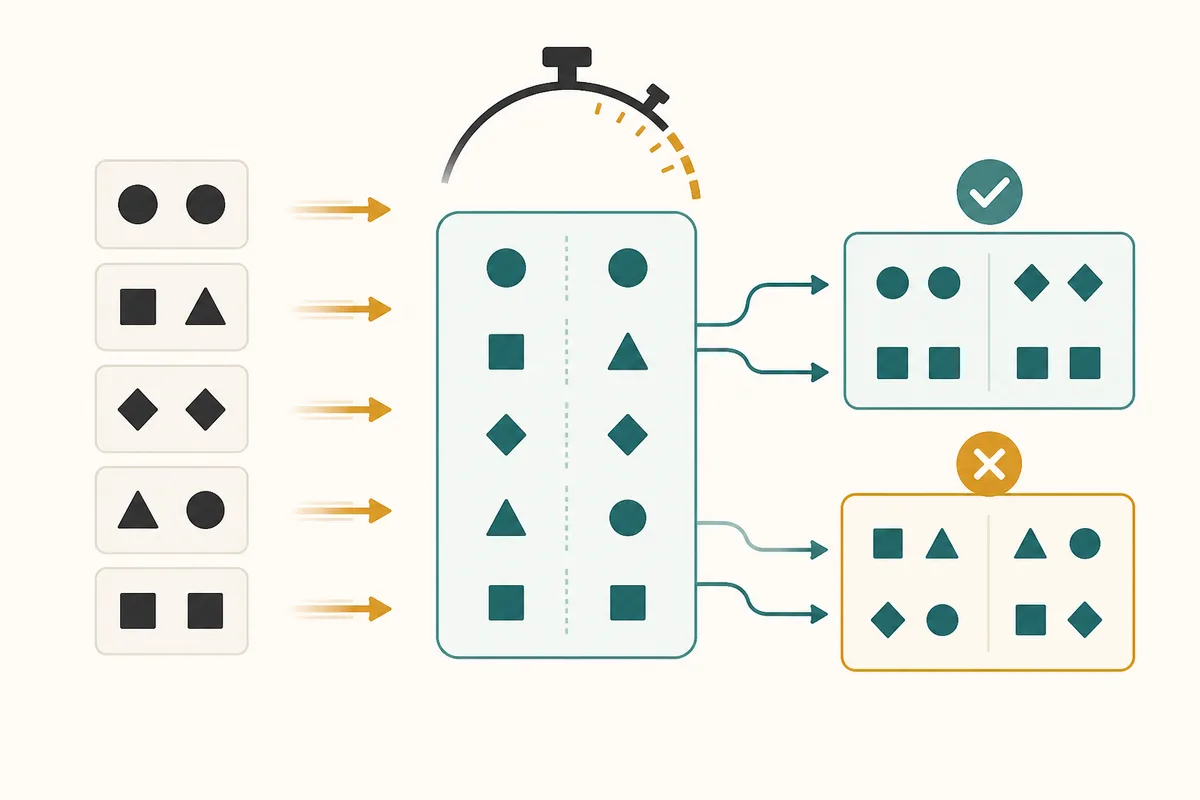
Every row asks the same thing. Two symbols sit on the left. Five sit on the right. Is either of the two over there?
There is nothing else to do and nothing to work out. You are not matching a pairing, spelling anything or holding a sequence. You read two shapes, sweep five, and press one of two buttons. That is the whole task, repeated.
Because the work is that small, the time it takes is worth measuring directly. The page reports the middle of your decision times rather than how many rows you got through. A middle time is a description of one typical decision, and a count is a description of a run.
The two symbols on the left change on every row. Hold them fixed and by the third row they would already be in your head. Reading the target group would then drop out of the task. What is left is a hunt for two shapes you were told about a minute ago. That is a memory test wearing this one's clothes.
Why the run length is yours to set
The settings panel offers 20, 40 or 60 rows, and any of the three gives a number that means the same thing. That is a property of a median rather than a kindness.
A count cannot do this. Count how many rows you clear and the answer only means something next to the clock it was taken against. So the clock has to be the same for everyone, every time. That is exactly why the digit symbol test fixes its window at ninety seconds and offers no choice at all. The two pages sit in the same hub and take opposite decisions here, for the same reason.
A middle decision time is not built that way. Twenty decisions and sixty decisions have the same middle, give or take the wobble that comes with fewer measurements. So the length is a comfort setting. Twenty rows is a quick look, sixty is a steadier figure, and your history stays comparable across all of them.
Sixty is steadier because of how a median behaves. Any single slow row moves it hardly at all, and more rows means the middle is pinned by more of them. If you plan to compare two runs, take both at the same length and take them the same distance from a coffee.
The rows with nothing in them are the slow ones
Half the rows hold one of the two targets and half hold neither, exactly, in an order you cannot read. The result card times the two kinds separately, and they will not match.
The reason is worth a sentence. When a target is there, you can stop the moment you hit it, and on average that happens somewhere in the middle of the five. When nothing is there, no such moment arrives. The only way to be sure is to reach the end, so an empty row costs you the whole sweep every time.
That gap is one of the most reliable findings in the study of visual search. It is also why this test balances its rows rather than leaving the mix to chance. A run that happened to draw more empty rows would post a slower headline for no reason belonging to the person taking it.
A difference between two conditions being the real finding is a shape this site uses more than once. What the Stroop effect actually shows is the clearest write-up of it here, and the logic transfers directly.
- A large gap usually means you are checking the row properly rather than guessing early.
- A gap near zero with high accuracy is unusual and often means you are sweeping all five whether or not you have found the target.
- A gap near zero with poor accuracy means the empty rows are being answered before they have been read.
Nobody has timed enough people to rank you
The comparison block on this page draws no bar. No percentile, no band, no better than most. That is deliberate and it is not what most sites offering this test will do.
Symbol search is a named subtest and it has been measured carefully for decades. All of that measurement is of a pencil. A person is handed a printed page and marks a yes or no box on every row. The published figure is how many rows were marked in two minutes, scaled for age. The number contains the speed of a hand moving down a sheet.
Nothing in that transfers to a decision timed in a browser. The hand is gone, the sheet is gone, and a per-decision time was never what was collected in the first place. There is no arithmetic that turns one into the other, only a guess dressed as a fact.
So this page shows your number, your best and your own history, and says the ranking does not exist. Where a figure does sit against published data we say so and show the curve. Average reaction time by age is the clearest example of one we can stand behind.
There is a second one, and it is relative rather than absolute. Processing speed by age gives the age curve as percentages of a young adult median. A relative curve survives the move from pencil to browser in a way that a raw count never does.
Where the milliseconds actually go
A decision here is around half a second, and only part of that is the search. Some of it is the eye moving, which it does in jumps rather than smoothly, and each jump costs a few tens of milliseconds. Some is the press itself. Some belongs to your screen, which paints when its refresh comes round rather than when it is asked.
That is why the honest comparison is you against you, on the same machine, rather than you against a stranger. Swap a 60 Hz laptop for a 144 Hz monitor and the number moves without anything about you changing. The methodology page explains what we can and cannot see from inside a browser.
What a quick time here says is that you found or ruled out a shape in a row of five quickly, on this screen, today. It is not a measure of how fast you think. It describes performance on this symbol-search task only.
Practise and the number will improve, and what improves is this task. Getting quicker at scanning rows of symbols makes you quicker at scanning rows of symbols. Repeat it under the same conditions to compare runs.
Questions
What is a good decision time on this test?
There is no published figure for a clicked version, so there is no honest cut-off to quote. Most first runs land somewhere between 600 and 1,000 ms, and later runs are usually quicker. Your own best over a few attempts is the comparison worth having.
Is this the same as the published Symbol Search task?
It is the same idea and not the same instrument. The clinical form is printed, marked with a pencil, and given and scored by someone trained to do it. This is a browser version of the task, and the number it produces is about this page only.
Why does the page not give me a percentile?
A percentile needs a distribution, and the published ones count rows marked on paper in two minutes. That figure contains the speed of a hand on a sheet, and it was never a time per decision. Converting one into the other would be a guess with a bar drawn around it.
Why are my no answers slower than my yes answers?
A yes can stop as soon as you spot the target, which on average is partway along the five. A no cannot stop early, because the only way to be sure nothing is there is to check everything. Almost everyone shows this gap and it is reported on the card.
Can I take it with the keyboard?
Yes. The left arrow answers yes and the right arrow answers no, matching where the two buttons sit. Y and N work as well. The arrows are the better pair for speed, because both hands can rest and neither answer needs a longer reach than the other.
Why did some of my presses do nothing?
A press that lands within 100 ms of a new row cannot be an answer to it. Nobody reads two symbols and checks five that quickly. Those are treated as a press that bounced, dropped from the timing, and counted on the result card.
Do wrong answers change my score?
Only by leaving themselves out. The median is taken over correct answers, so a wrong row contributes no time at all. Accuracy sits next to the score, which is what makes a fast careless run visible rather than flattering.
How is this different from the digit symbol test?
There you are given a key and have to produce the symbol that goes with a digit. The score is how many you produce in ninety seconds. Here you produce nothing. You answer one question about a row you can see, and the score is how long that answer took.
Sources
- Wechsler D (2008). Wechsler Adult Intelligence Scale, Fourth Edition (WAIS-IV): Technical and Interpretive Manual. Pearson. Link
- Treisman AM, Gelade G (1980). A feature-integration theory of attention. Cognitive Psychology, 12(1), 97-136. Link
- Wolfe JM (1998). What can 1 million trials tell us about visual search? Psychological Science, 9(1), 33-39. Link